The Aurora Borealis (and its southern counterpart, the Aurora Australis) is one of nature’s most spectacular displays - curtains of light rippling across the polar sky in green, purple and red. But what actually causes them? The answer begins 150 million kilometres away, on the surface of the Sun.
What Causes The Northern Lights?
The aurora is a result of charged particles from the Sun interacting with the Earth’s atmosphere. These particles, primarily electrons and protons, are ejected from the Sun in a constant stream called the solar wind, travelling at speeds of 300-800 km/s.
As the solar wind reaches Earth, it encounters our planet’s magnetosphere - a magnetic shield generated by Earth’s molten iron core. This field deflects most of the incoming particles, protecting life on the surface from harmful radiation. However, some charged particles get trapped in the magnetic field lines and are funnelled towards the magnetic poles along paths called field-aligned currents.
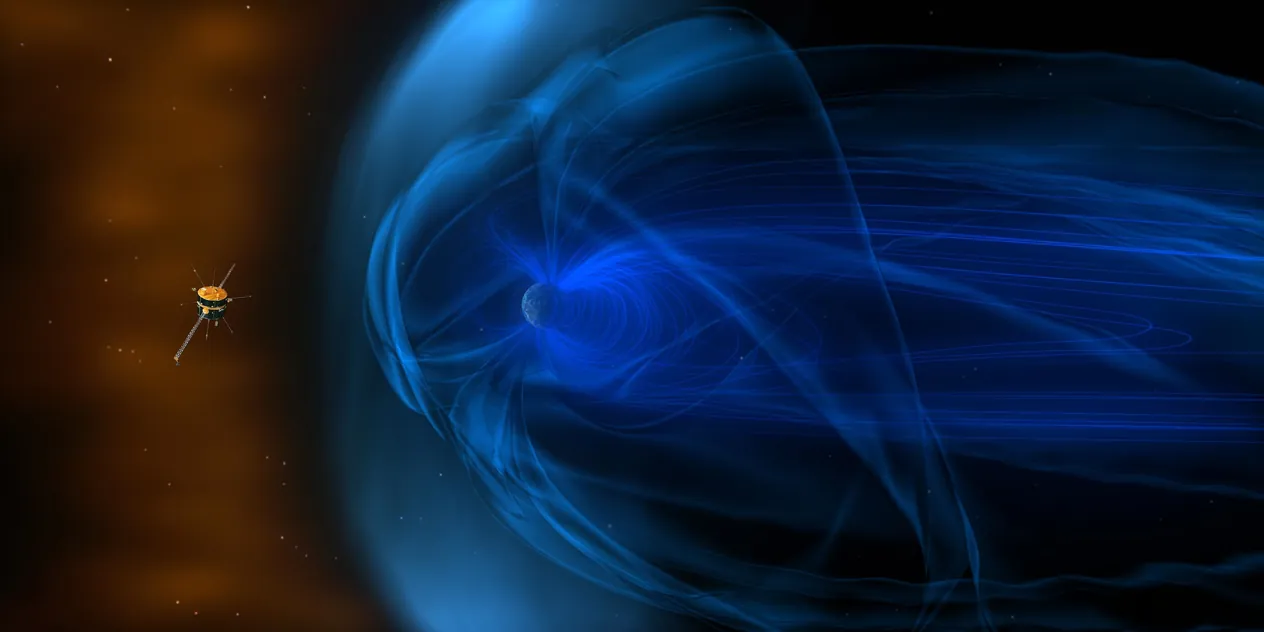
Credit: NASA Goddard Space Flight Center
Earth’s magnetosphere deflects the solar wind, but some charged particles are funnelled along magnetic field lines towards the poles, where they create the aurora.
When these energetic particles collide with atoms and molecules in the upper atmosphere (at altitudes of roughly 100-300 km), they transfer energy. The atoms become “excited” - their electrons jump to a higher energy state. As the electrons drop back down, the atoms release that energy as photons of light. These photons are what we see as the aurora.
The process is essentially the same as what happens inside a neon light - gas atoms are energised and emit light at characteristic wavelengths - except the aurora operates on a planetary scale, powered by the Sun itself.
Why Can The Aurora Be Different Colours?
The colour of the aurora depends on which gas is being excited and at what altitude the collision occurs. Different atmospheric gases emit light at different wavelengths when their electrons return to their ground state.
- Red occurs at high altitudes, around 200-500 km. At these heights, oxygen is sparse and atoms have more time between collisions, allowing them to emit red photons (wavelength 630 nm). Red aurora is relatively rare and often only visible during strong geomagnetic storms.
- Green is the most common colour, occurring at around 100-300 km above Earth where oxygen concentrations are highest. Oxygen atoms emit green photons (wavelength 558 nm) when they return to their ground state more quickly due to frequent collisions. Combined with the human eye’s peak sensitivity to green light, this makes it the dominant colour in most displays.
- Blue and Purple occur below 100 km, caused by interactions with nitrogen molecules. Ionised nitrogen produces blue light, while neutral nitrogen emits purple and violet hues. If present, you’ll usually see these colours towards the bottom of the display, adding depth to the curtains above.
During particularly strong displays, you may see all three colour bands simultaneously - red at the top, green in the middle and purple at the base. Cameras are often more sensitive to these colours than the naked eye, which is why aurora photographs can appear more vivid than what you see in person.
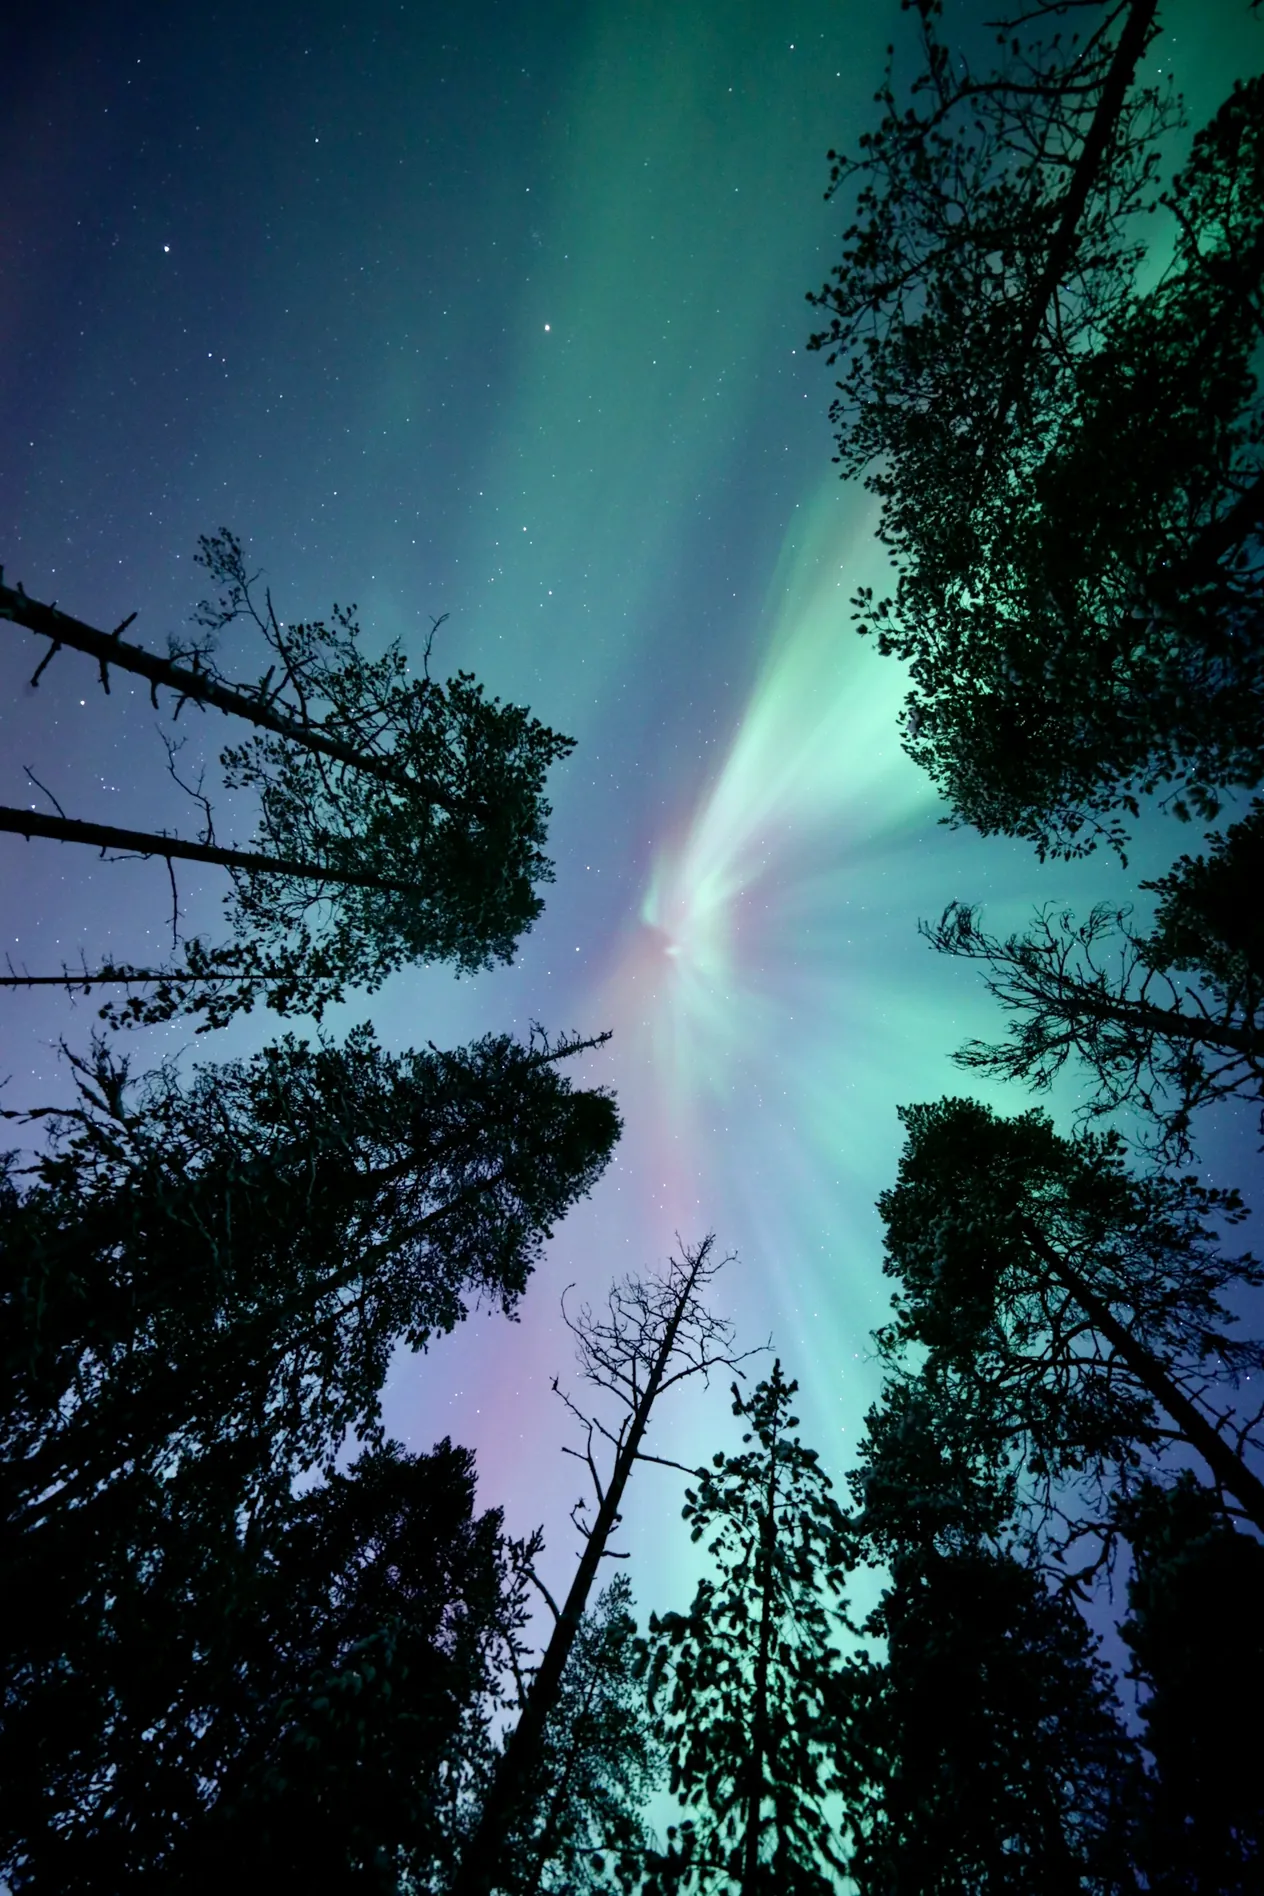
Credit: Dylan Shaw
A vivid aurora corona over Rovaniemi, Finland, displaying green from oxygen emissions and pink-purple from nitrogen at lower altitudes.
Types Of Auroral Display
Not all auroras look the same. The shape and behaviour of the display depends on the structure of the magnetic field lines and the intensity of the particle bombardment. There are several recognised forms:
Arcs are the most common form - long, gently curving bands of light stretching east to west across the sky. They often appear early in the evening when activity is building and can remain stable for hours. A quiet, steady green arc low on the northern horizon is what you’ll see most often on nights of moderate activity.
Bands are similar to arcs but with more pronounced folds and curves, giving them a ribbon-like appearance. As geomagnetic activity increases, arcs often develop into bands with visible kinks and undulations.
Curtains (or draperies) are the classic aurora form that most people imagine - tall, vertical sheets of light that appear to ripple and fold like fabric blowing in the wind. They can extend from near the horizon to high overhead and are often the most dynamic and visually striking form.
Coronas occur when you are standing directly beneath an auroral display. The perspective creates a radiating pattern - rays of light appear to converge on a single point directly overhead, like looking up into a cathedral dome of light. Coronas indicate very strong activity and are an unforgettable sight.
Pulsating aurora is a diffuse, patchy form that appears to “breathe” - patches of light turning on and off rhythmically every few seconds. It typically occurs in the later stages of a substorm, often after midnight, and is caused by a different mechanism involving wave-particle interactions in the magnetosphere.
The Solar Cycle
The Sun’s activity follows an approximately 11-year cycle, swinging between periods of solar minimum (few sunspots, less activity) and solar maximum (many sunspots, frequent eruptions). This cycle has a direct impact on the frequency and intensity of auroral displays.
During solar maximum, the Sun produces more coronal mass ejections (CMEs) - massive eruptions of magnetised plasma that, when directed at Earth, can trigger powerful geomagnetic storms and spectacular aurora visible at much lower latitudes than usual. The May 2024 storm that brought aurora as far south as southern England and the southern United States was a product of the current solar maximum (Solar Cycle 25).
However, the relationship isn’t as simple as “more sunspots = more aurora.” Some of the best aurora seasons occur on the declining phase of the solar cycle, when high-speed solar wind streams from coronal holes become more prevalent. These streams produce sustained, moderate geomagnetic activity that favours frequent aurora at high latitudes, even if the individual storms aren’t as dramatic as those at solar maximum.
For aurora hunters, the practical takeaway is that every year within a few years either side of solar maximum offers good chances. The current solar maximum is expected to continue producing elevated activity in 2026.
Geomagnetic Storms And The Kp Index
Geomagnetic storms occur when the solar wind interacts strongly with Earth’s magnetosphere, typically triggered by a CME impact or a sustained period of southward-pointing interplanetary magnetic field. The intensity of these storms is measured on several scales, but the one most relevant to aurora watchers is the Kp index.
The Kp index ranges from 0 to 9, derived from magnetometer readings at observatories around the world. It represents the level of disturbance in Earth’s magnetic field over a three-hour period. Here’s roughly what each level means for aurora viewing:
- Kp 0-1: Very quiet. Aurora confined to the highest latitudes. You’d need to be above 66°N (e.g. Tromsø, Abisko) and might see only a faint arc on the northern horizon.
- Kp 2-3: Quiet to unsettled. Aurora visible across the auroral zone. Good displays possible in northern Scandinavia, Fairbanks, and northern Iceland.
- Kp 4-5: Active to minor storm. Aurora brightens and the oval expands southward. Visible in southern Iceland, northern Scotland, and southern Canada. Dynamic displays with curtains and colour.
- Kp 6-7: Moderate to strong storm. Aurora visible at mid-latitudes - northern England, central Europe, the northern United States. Vivid, fast-moving displays.
- Kp 8-9: Severe to extreme storm. Rare events, occurring perhaps a few times per solar cycle. Aurora visible as far south as the Mediterranean, the southern US, and even into the tropics. The May 2024 event reached Kp 9.
Check our aurora forecast to see current Kp levels and predictions, or read our guide to how to read an aurora forecast for a more detailed explanation.
Bz And The Interplanetary Magnetic Field
While the Kp index tells you what’s happening now, the most important real-time indicator for aurora watchers is Bz - the north-south component of the interplanetary magnetic field (IMF).
Earth’s magnetic field points northward. When the solar wind’s magnetic field also points northward (Bz positive), it acts against reconnection with Earth’s field, and the magnetosphere remains relatively closed - like two magnets repelling each other. But when Bz turns southward (negative), the solar wind’s magnetic field can connect directly with Earth’s, allowing energy and particles to pour into the magnetosphere. This process, called magnetic reconnection, is the primary driver of auroral activity.
In practical terms, you want to see Bz at -10 nT or lower (i.e. strongly southward) for good aurora. The more negative the Bz, the more energy enters the system and the brighter and more widespread the aurora becomes. A sustained Bz of -20 nT or below combined with high solar wind speed (above 500 km/s) is the recipe for a major storm.
The solar wind takes roughly 15-45 minutes to travel from the ACE and DSCOVR monitoring satellites (positioned at the L1 Lagrange point, 1.5 million km sunward of Earth) to our magnetosphere, giving forecasters - and aurora chasers - a brief but valuable heads-up.
Substorms vs Geomagnetic Storms
One of the most misunderstood aspects of aurora science is the difference between a geomagnetic storm and a substorm. They are related but distinct phenomena, and understanding the difference will make you a better aurora hunter.
A geomagnetic storm is a prolonged disturbance of the entire magnetosphere, typically lasting hours to days. It’s driven by sustained solar wind forcing (a CME impact or persistent southward Bz) and is what the Kp index measures. Storms expand the aurora oval equatorward, making the lights visible at lower latitudes.
A substorm is a shorter, more localised event lasting 1-3 hours. It occurs when energy stored in the magnetotail (the stretched-out tail of the magnetosphere on Earth’s night side) is suddenly released. Think of it like a rubber band being stretched and then snapping back. The energy release sends a surge of particles into the atmosphere, causing a rapid brightening and intensification of the aurora - the moment when a quiet arc suddenly explodes into dynamic, fast-moving curtains.
Substorms can occur during geomagnetic storms (often multiple times), but they also happen independently during otherwise quiet conditions. This is why you can sometimes see a spectacular 30-minute burst of aurora even when the Kp index is relatively low. If you’re in the auroral zone and conditions look marginal, it’s always worth staying out - a substorm can transform the sky without warning.
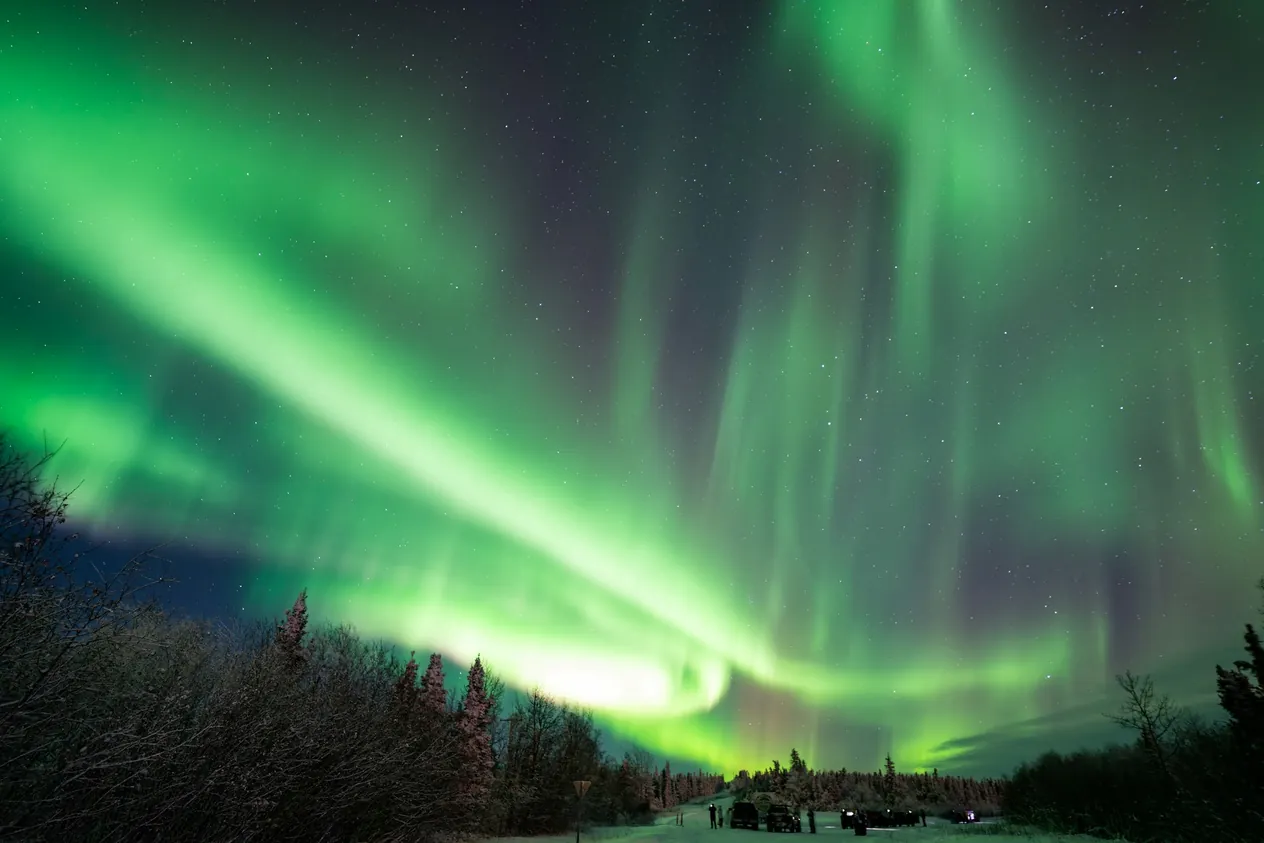
Credit: Chenghui Li
A substorm-driven display over Fairbanks, Alaska, showing the dramatic curtain forms and rapid brightening characteristic of magnetotail energy release.
The Equinox Effect
One of the most well-established patterns in aurora science is the semi-annual variation in geomagnetic activity. Geomagnetic storms are roughly twice as likely around the equinoxes (March and September) compared to the solstices (June and December). This isn’t a coincidence - it’s a consequence of geometry.
The phenomenon is explained by the Russell-McPherron effect. Earth’s magnetic dipole is tilted at about 11° from its rotational axis, and the solar wind’s magnetic field lies roughly in the plane of the Sun’s equator. Around the equinoxes, the geometry of these two fields is most favourable for magnetic reconnection - the southward component of the IMF (Bz) is more likely to couple effectively with Earth’s field.
For aurora hunters, the practical implication is significant: September/October and February/March are statistically the best months for strong displays. Many experienced aurora chasers time their trips to coincide with these equinox windows, and destinations like Tromsø, Abisko and Reykjavík see peak visitor numbers during these periods.
The Aurora Oval
The aurora doesn’t occur randomly across the sky. It’s concentrated in a ring-shaped zone centred on Earth’s magnetic poles called the aurora oval (or auroral oval). This oval typically sits between 65° and 72° magnetic latitude, encompassing the prime aurora-viewing destinations: northern Norway, Swedish Lapland, Finnish Lapland, Iceland, Alaska and northern Canada.
The oval is not static. It expands and contracts based on the intensity of solar wind forcing and geomagnetic storms. During quiet conditions (Kp 0-2), the oval is narrow and confined to the highest latitudes. As the Kp index rises, the oval expands equatorward and broadens, bringing aurora to progressively lower latitudes.
Crucially, the brightness within the oval varies too. The most intense aurora typically occurs on the poleward edge of the oval during the expansion phase of a substorm. Locations that sit underneath the oval - rather than south of it looking northward - tend to see overhead aurora with visible structure, while locations further south may only see a diffuse glow on the northern horizon.
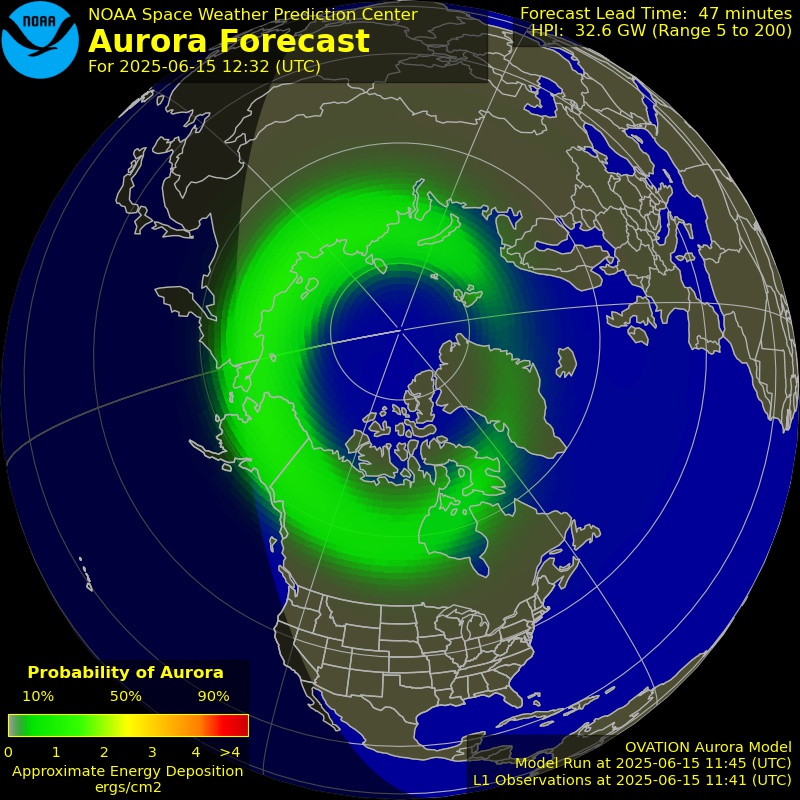
The NOAA Ovation map shows the current position and intensity of the aurora oval in near real-time, based on solar wind data from upstream monitoring satellites.
The NOAA Ovation map (shown above) is one of the best tools for aurora forecasting. While the Kp index gives a general idea of geomagnetic activity strength, the Ovation map pinpoints exactly where you might see the aurora and how intense the display is likely to be.
It uses real-time solar wind and magnetic field data to predict aurora visibility 30 to 40 minutes in advance. Keep in mind that even if the Ovation map predicts aurora in your area, you still need clear skies and minimal light pollution to see it.
Can You Hear The Aurora?
For centuries, people in the Arctic have reported hearing faint sounds during aurora displays - crackling, hissing or popping noises that seem to coincide with the movement of the lights. These reports were long dismissed by scientists, since the aurora occurs at altitudes of 100 km or more, far too high for sound waves to travel to the ground.
However, research from Aalto University in Finland has confirmed that the sounds are real. Professor Unto K. Laine recorded and analysed sounds at a height of approximately 70 metres above ground level that correlated with geomagnetic activity. The current hypothesis is that the sounds are produced by electrical discharges in the lower atmosphere, caused by the same geomagnetic disturbances that drive the visual aurora - but much closer to the ground.
The sounds are faint and fleeting, most likely to be heard on very cold, calm nights away from any background noise. The Sámi people of northern Scandinavia have a name for the aurora - “guovssahas” - which some linguists translate as “the light you can hear.” Read more about their relationship with the lights in our Myths and Legends article.
Aurora Australis
Everything described above applies equally to the southern hemisphere, where the phenomenon is known as the Aurora Australis (or Southern Lights). The northern and southern auroras are mirror images of each other - they occur simultaneously and are driven by the same solar wind conditions.
So why don’t we hear as much about the Aurora Australis? Geography. The southern auroral oval sits over Antarctica and the Southern Ocean, with almost no inhabited land beneath it. While New Zealand’s South Island, Tasmania, the Falkland Islands and the southern tip of South America occasionally see displays during strong storms (as they did during the May 2024 event), there’s no southern equivalent of Tromsø or Fairbanks - a city with good infrastructure sitting directly under the auroral oval.
For this reason, the vast majority of aurora tourism and forecasting focuses on the Northern Lights, though the Southern Lights are every bit as beautiful for those who can reach the right viewing spots.
Further Reading
Laine, U.K. (2012) Analysis of clap sounds recorded during the September 9-10 2011 geomagnetic storm Proc. 19th International Congress on Sound and Vibration, Vilnius. https://www.researchgate.net/publication/258223115
If you’d like to learn more about the Northern Lights, explore our other guides:
- Aurora Forecast - live solar wind data and aurora predictions
- How To Read An Aurora Forecast - understanding Kp, Bz, solar wind speed and more
- Best Time Of Year To See The Northern Lights - month-by-month guide
- Planning Your Northern Lights Adventure - choosing a destination and preparing your trip
- Northern Lights Photography - camera settings and techniques
- Northern Lights Myths And Legends - cultural stories from around the world
- Aurora Glossary - definitions of key terms